

quarterly outcome Reports
The investments in A Home for Everyone, and the creation of a City of Portland/Multnomah County Joint Office of Homeless Services, have made a difference for thousands of people who might otherwise be experiencing homelessness.
To see our outcomes over the past few years, please click on our interactive Tableau report below that charts outcomes in housing placement, homelessness prevention, shelter and income improvements, among other markers.

Click on the image to launch an interactive Tableau presentation.
Click on the image to access an interactive Tableau presentation.
Click on the image to launch an interactive Tableau presentation of the data.
Click on the image to launch a Tableau presentation of data for FY2020.
Click the image above to interact with the data
You can also read printable, non-interactive PDF versions of quarterly reports.

Year-end Report, Fiscal Year 2021
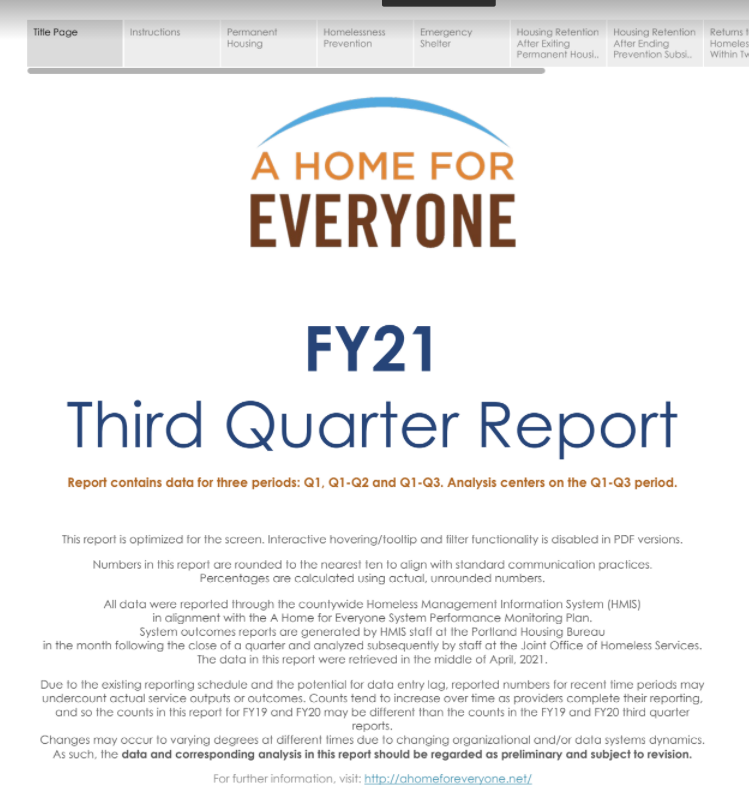
Q1-Q3, Fiscal Year 2021

Q1-Q2, Fiscal Year 2021

Year-end Report, Fiscal Year 2020
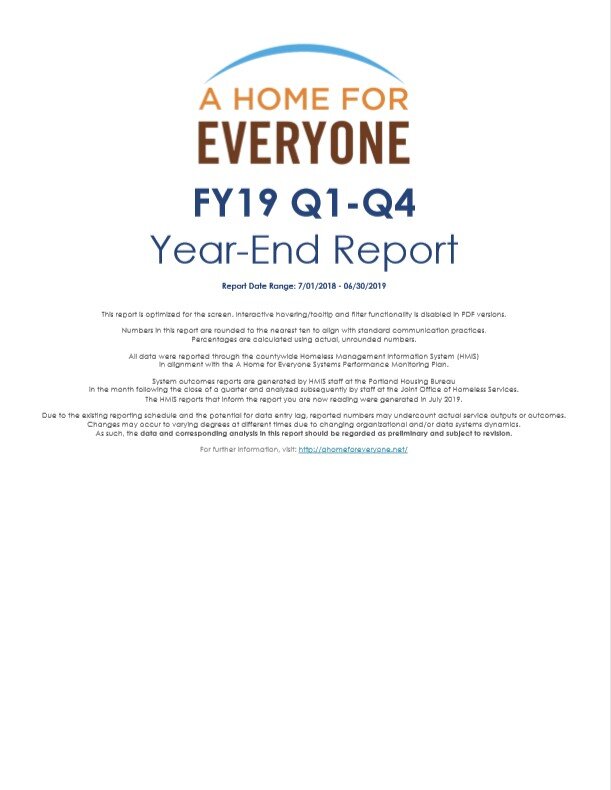
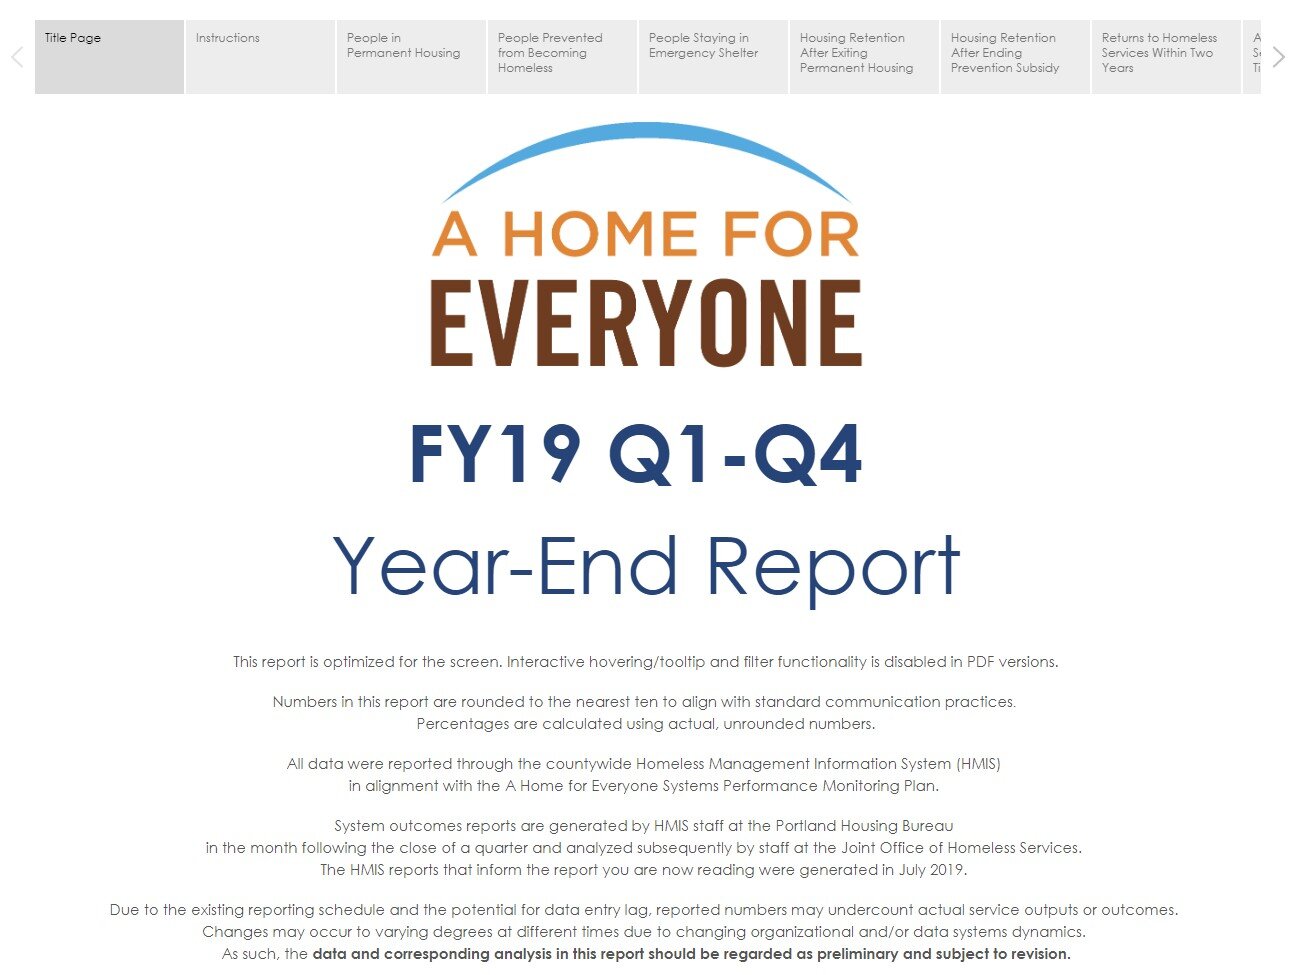
Year-end Report, Fiscal Year 2019
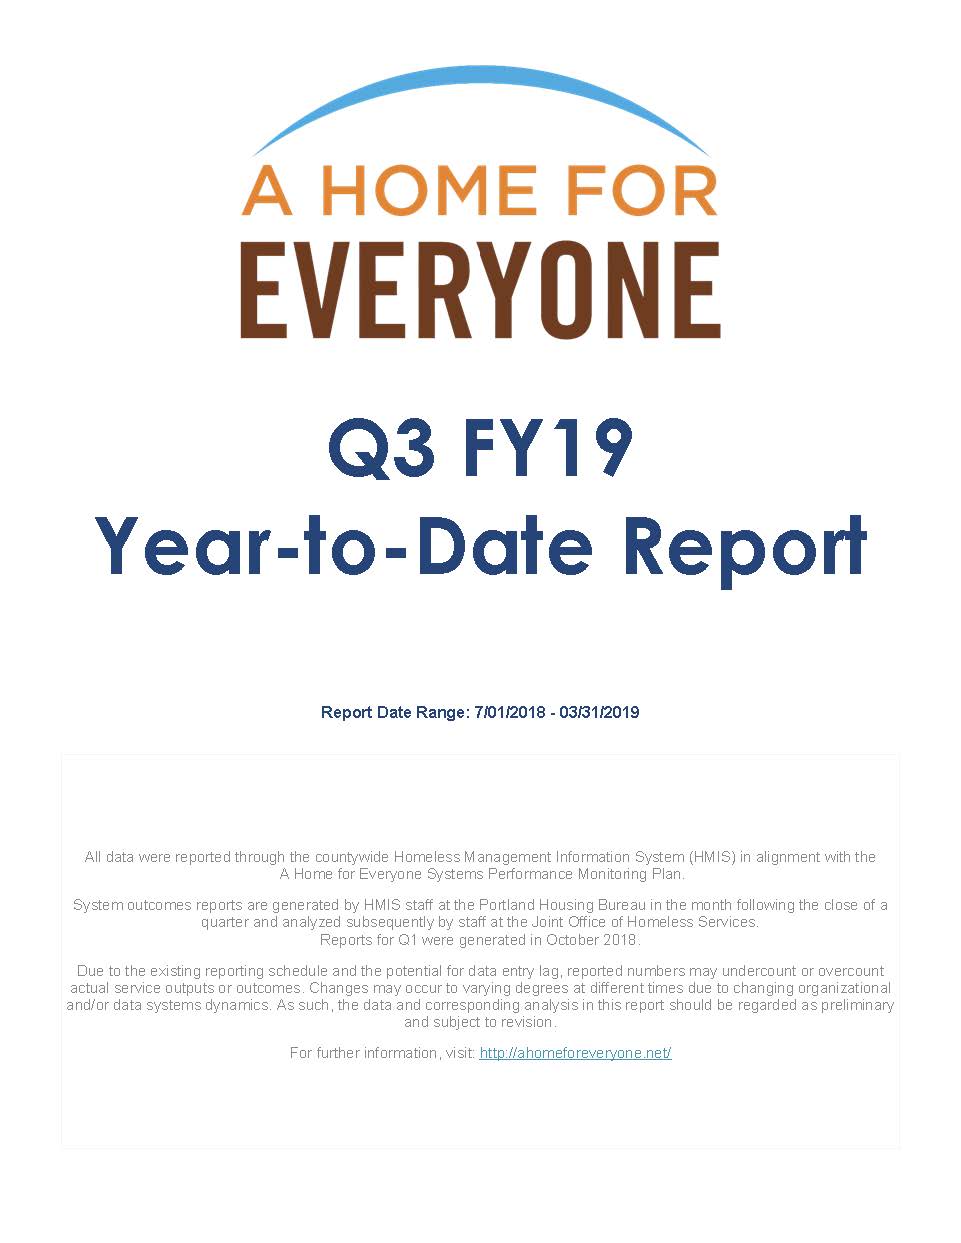
Q3, Fiscal Year 2019
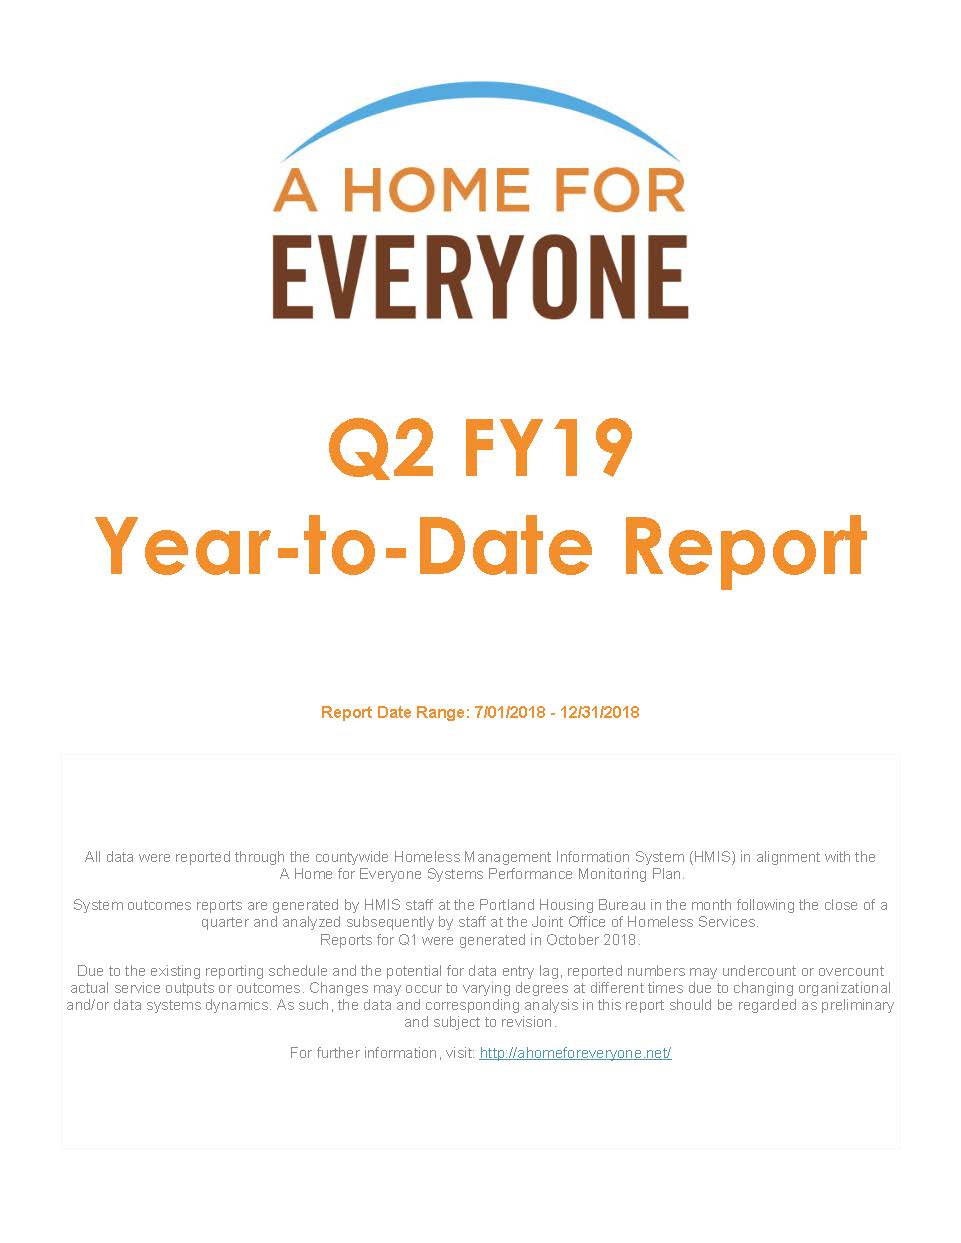
Q2, Fiscal Year 2019
Q1, Fiscal Year 2019
Year-end report, Fiscal Year 2018
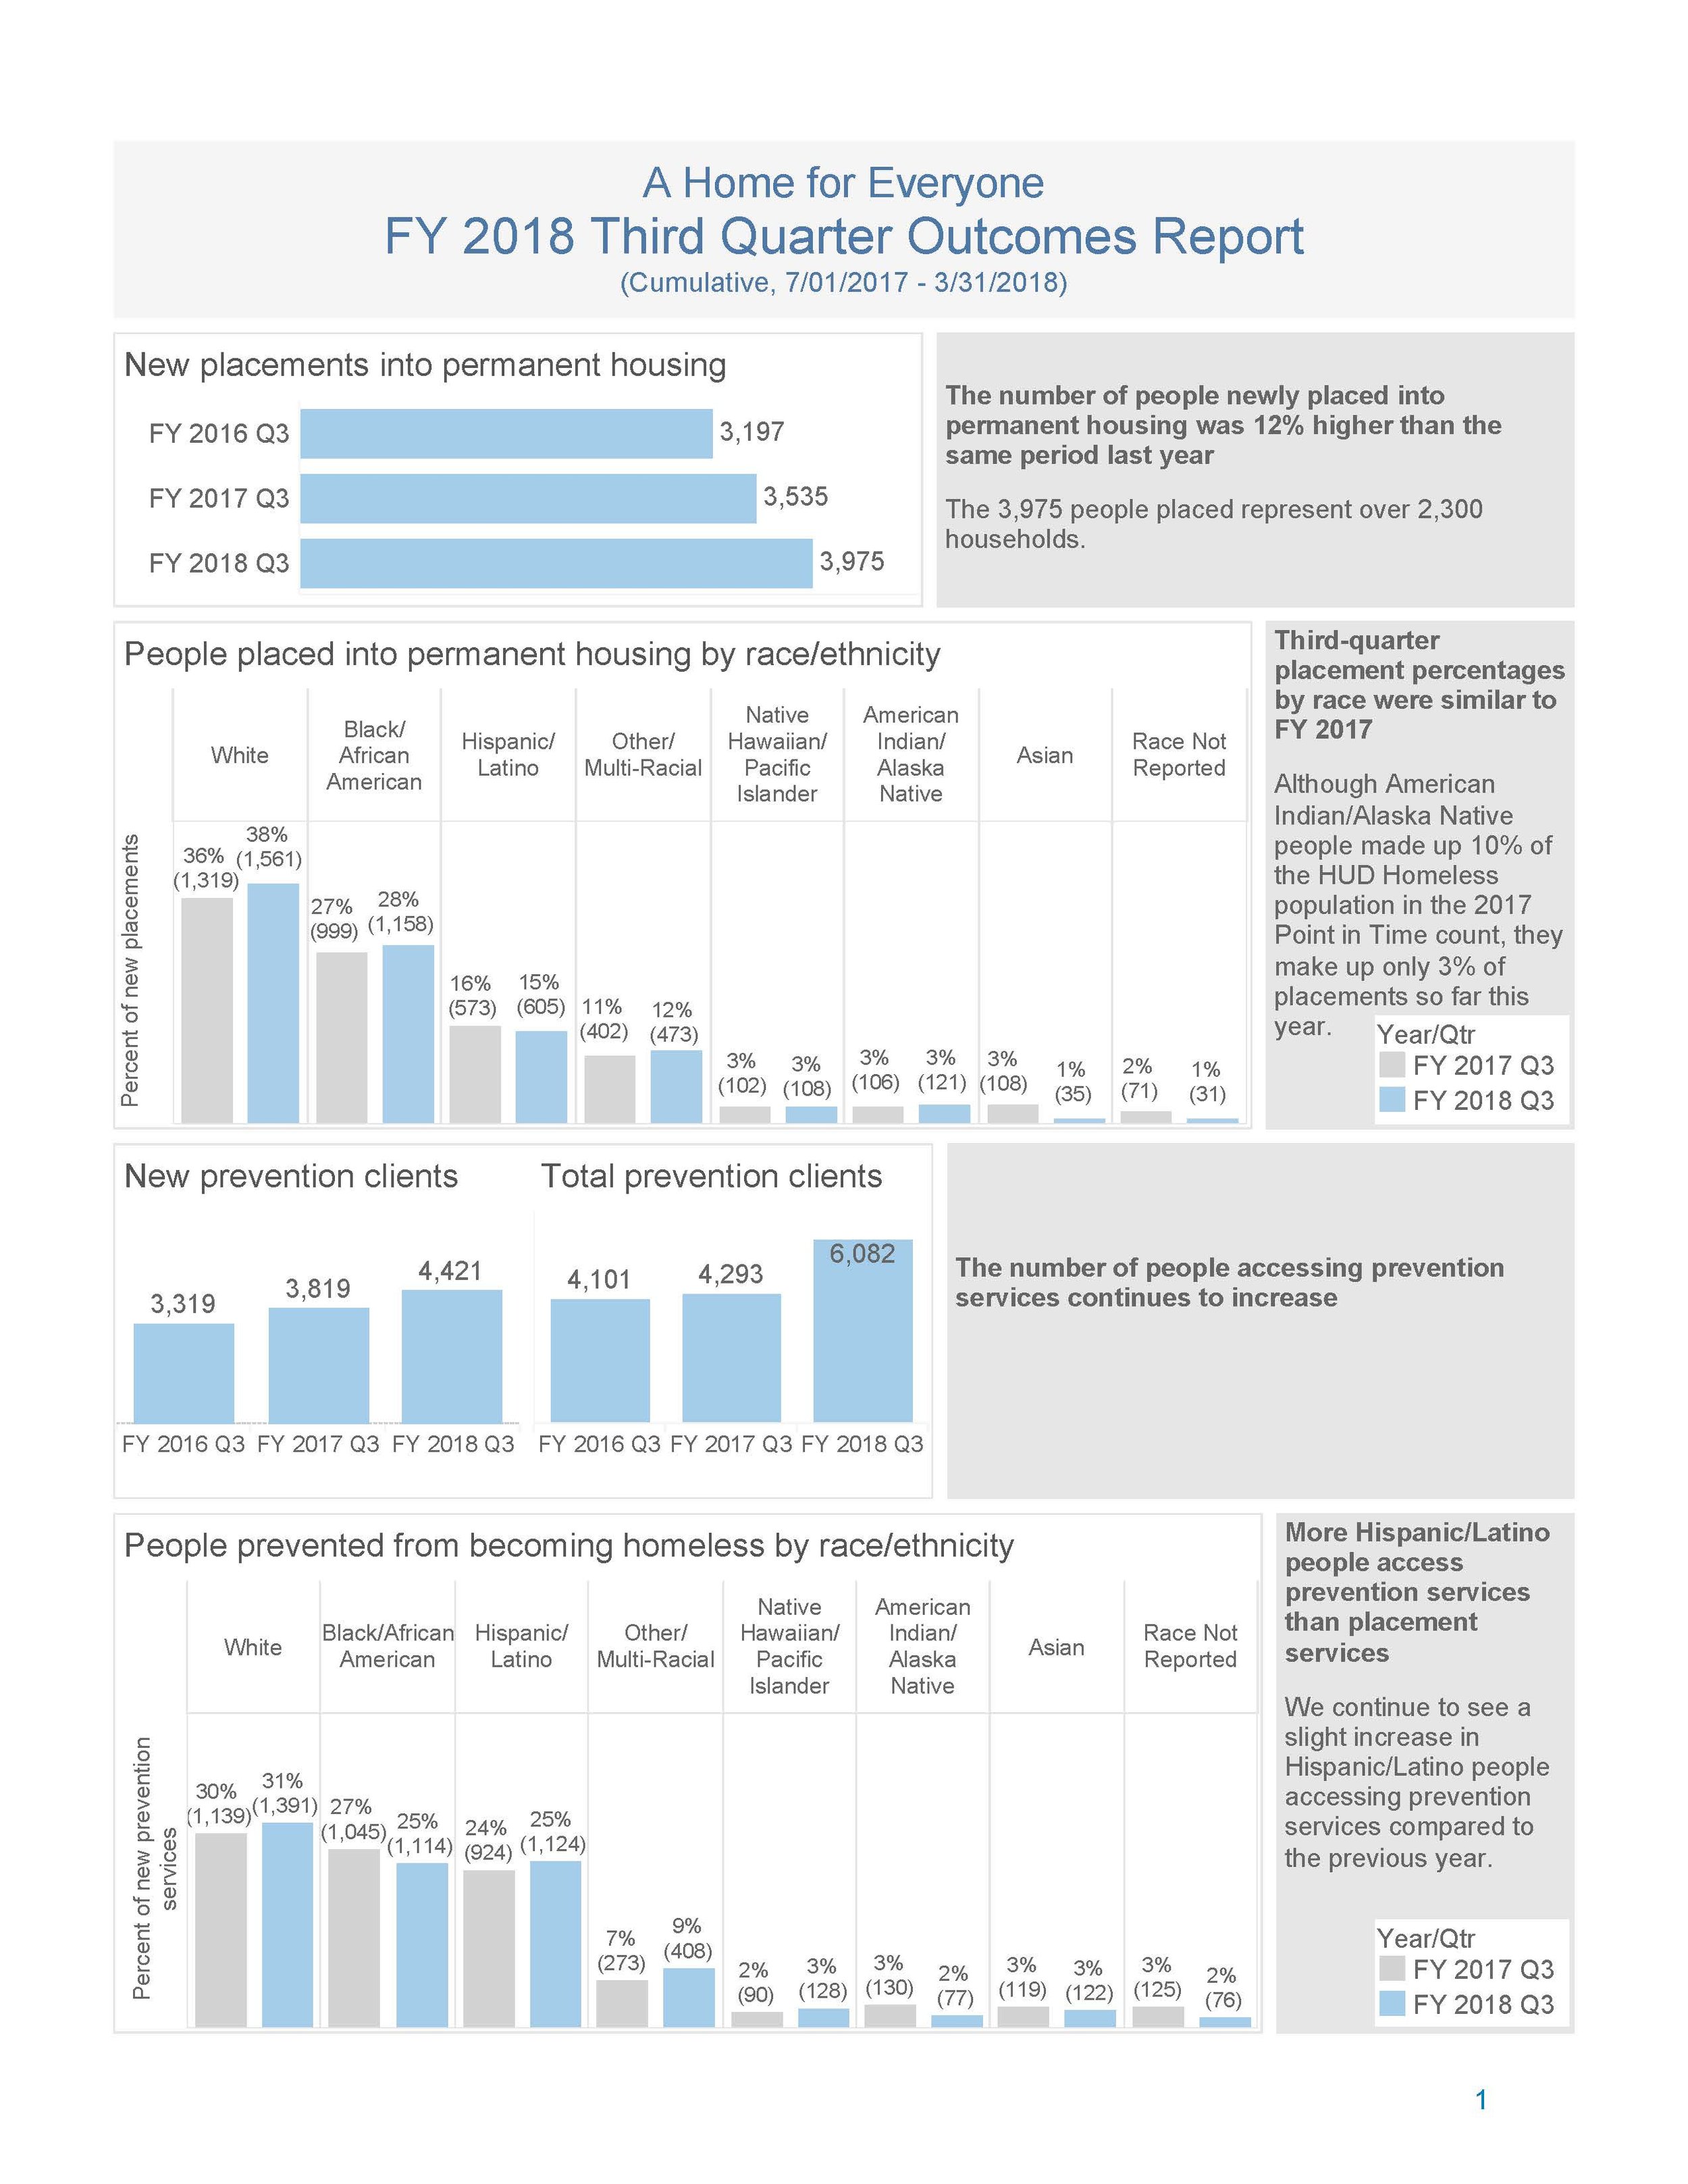
Q3, Fiscal Year 2018
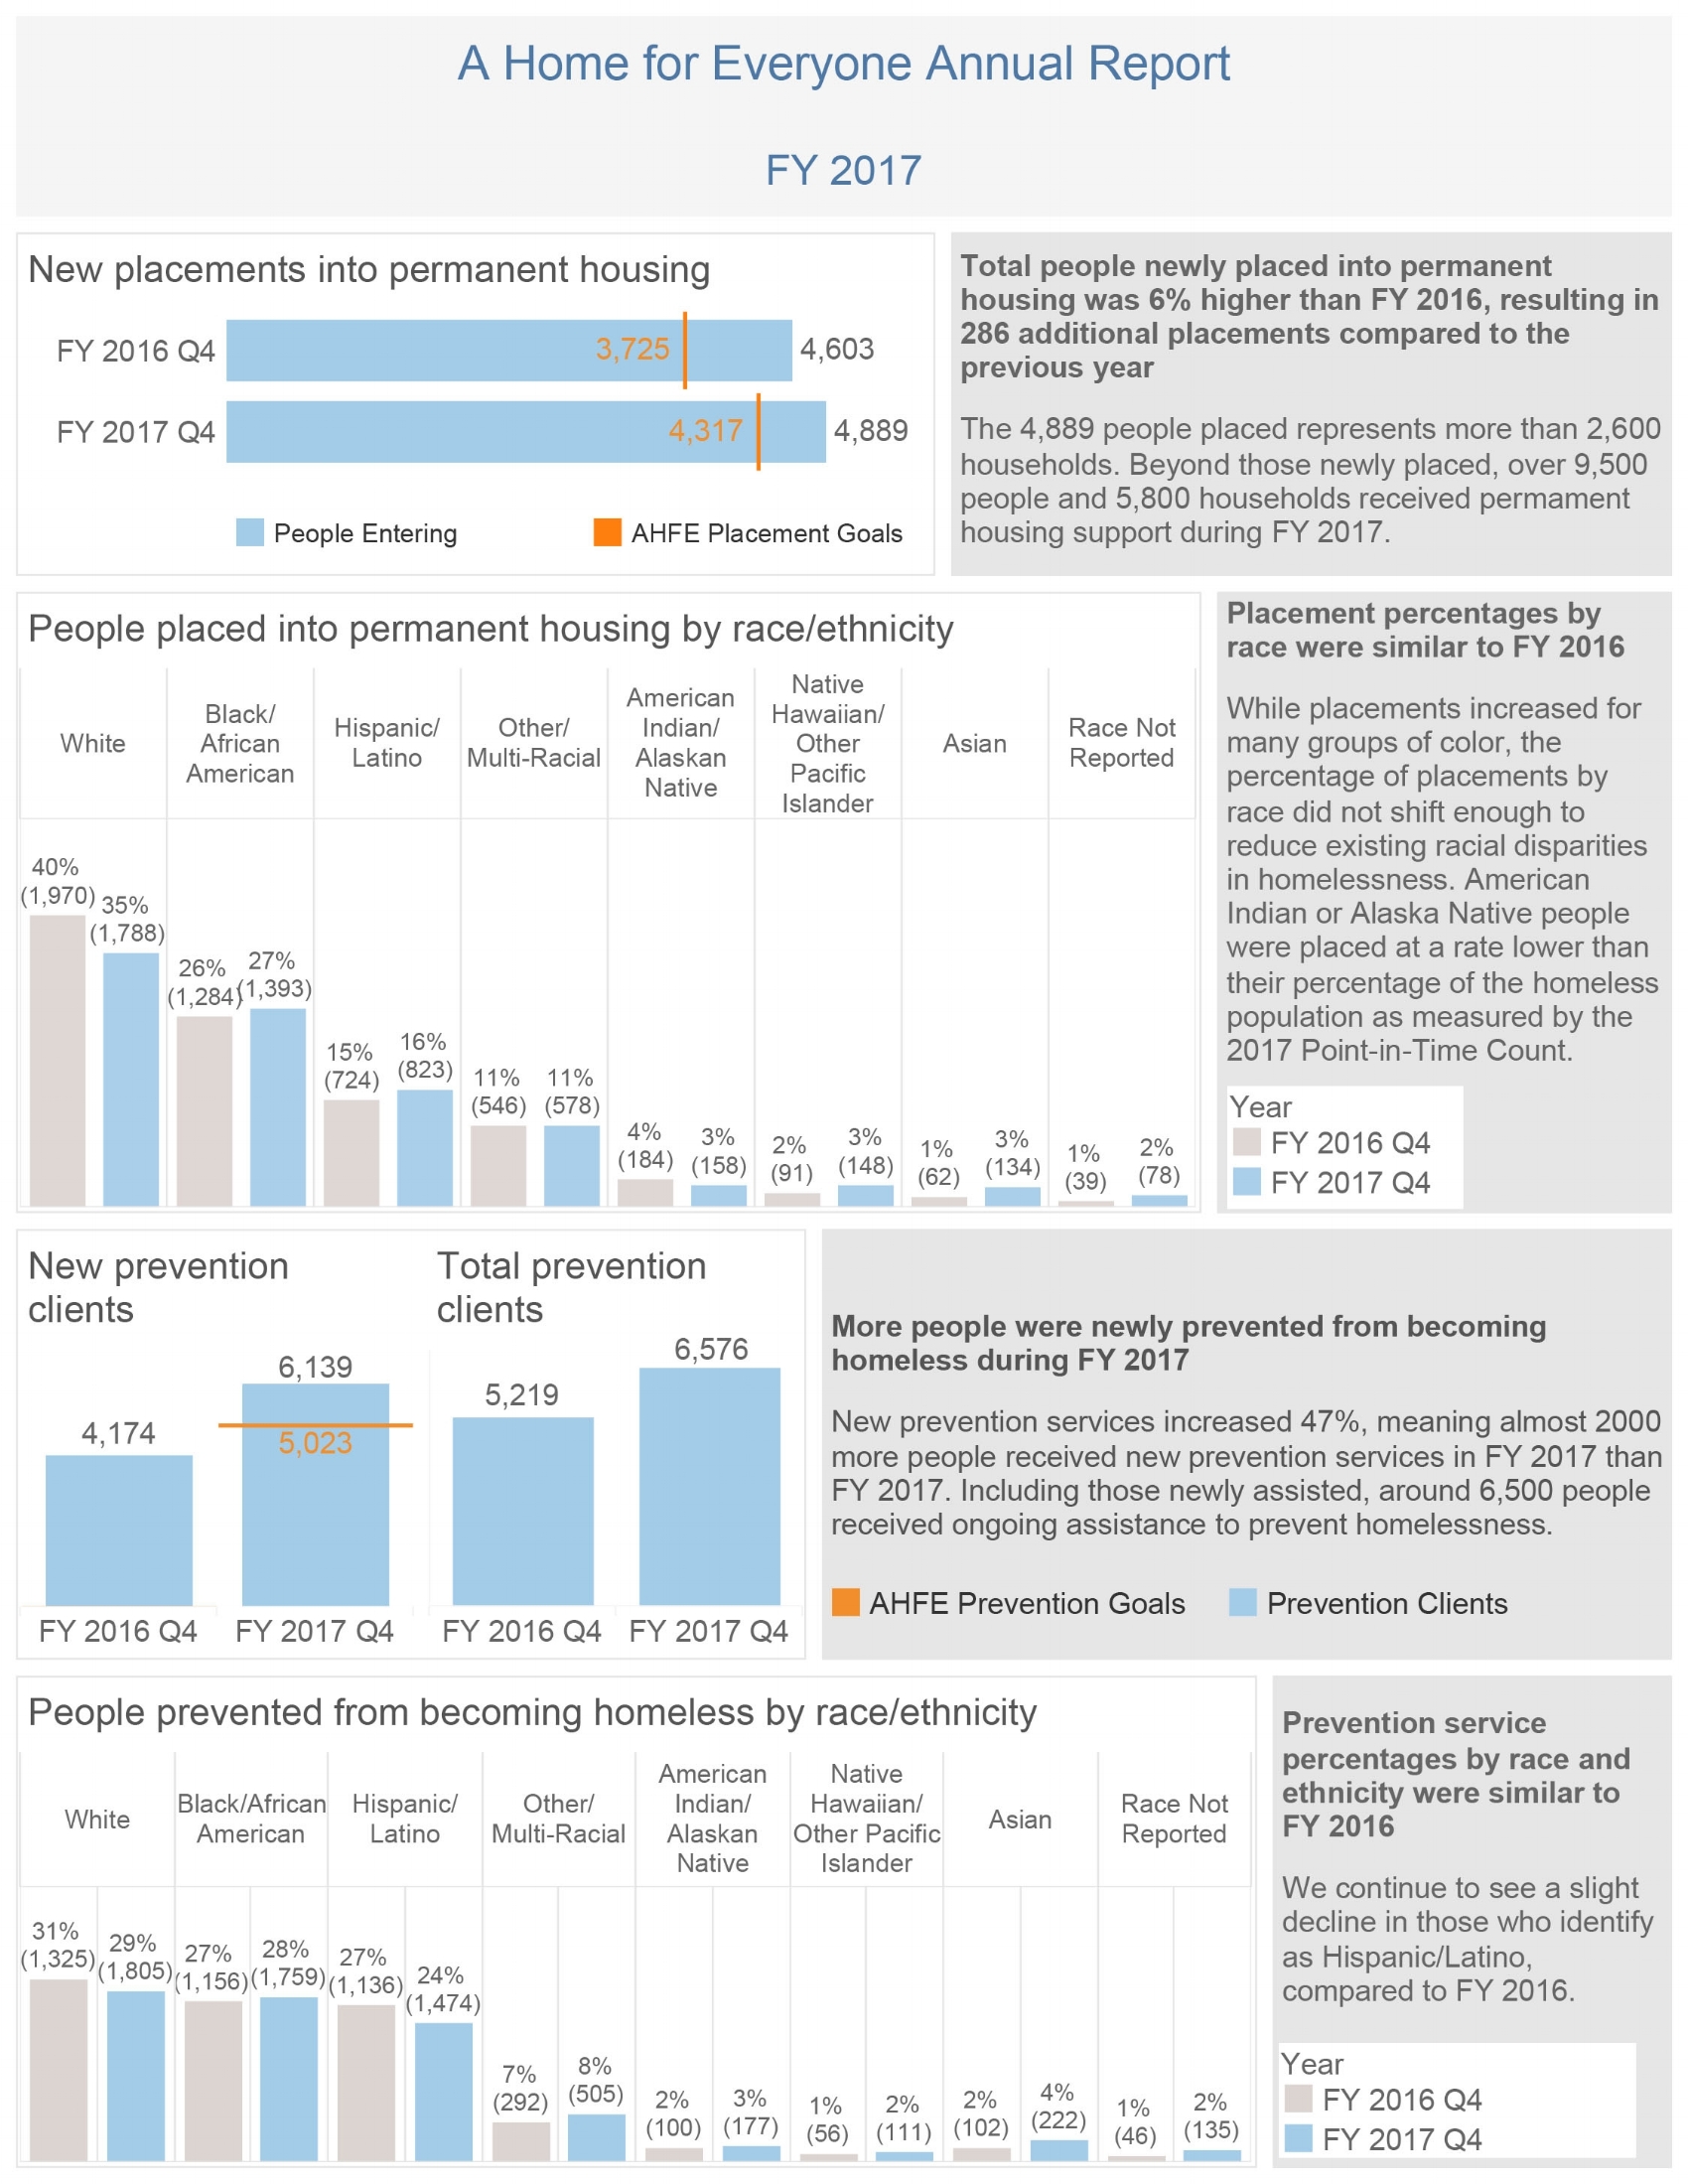
Year-end report, Fiscal Year 2017
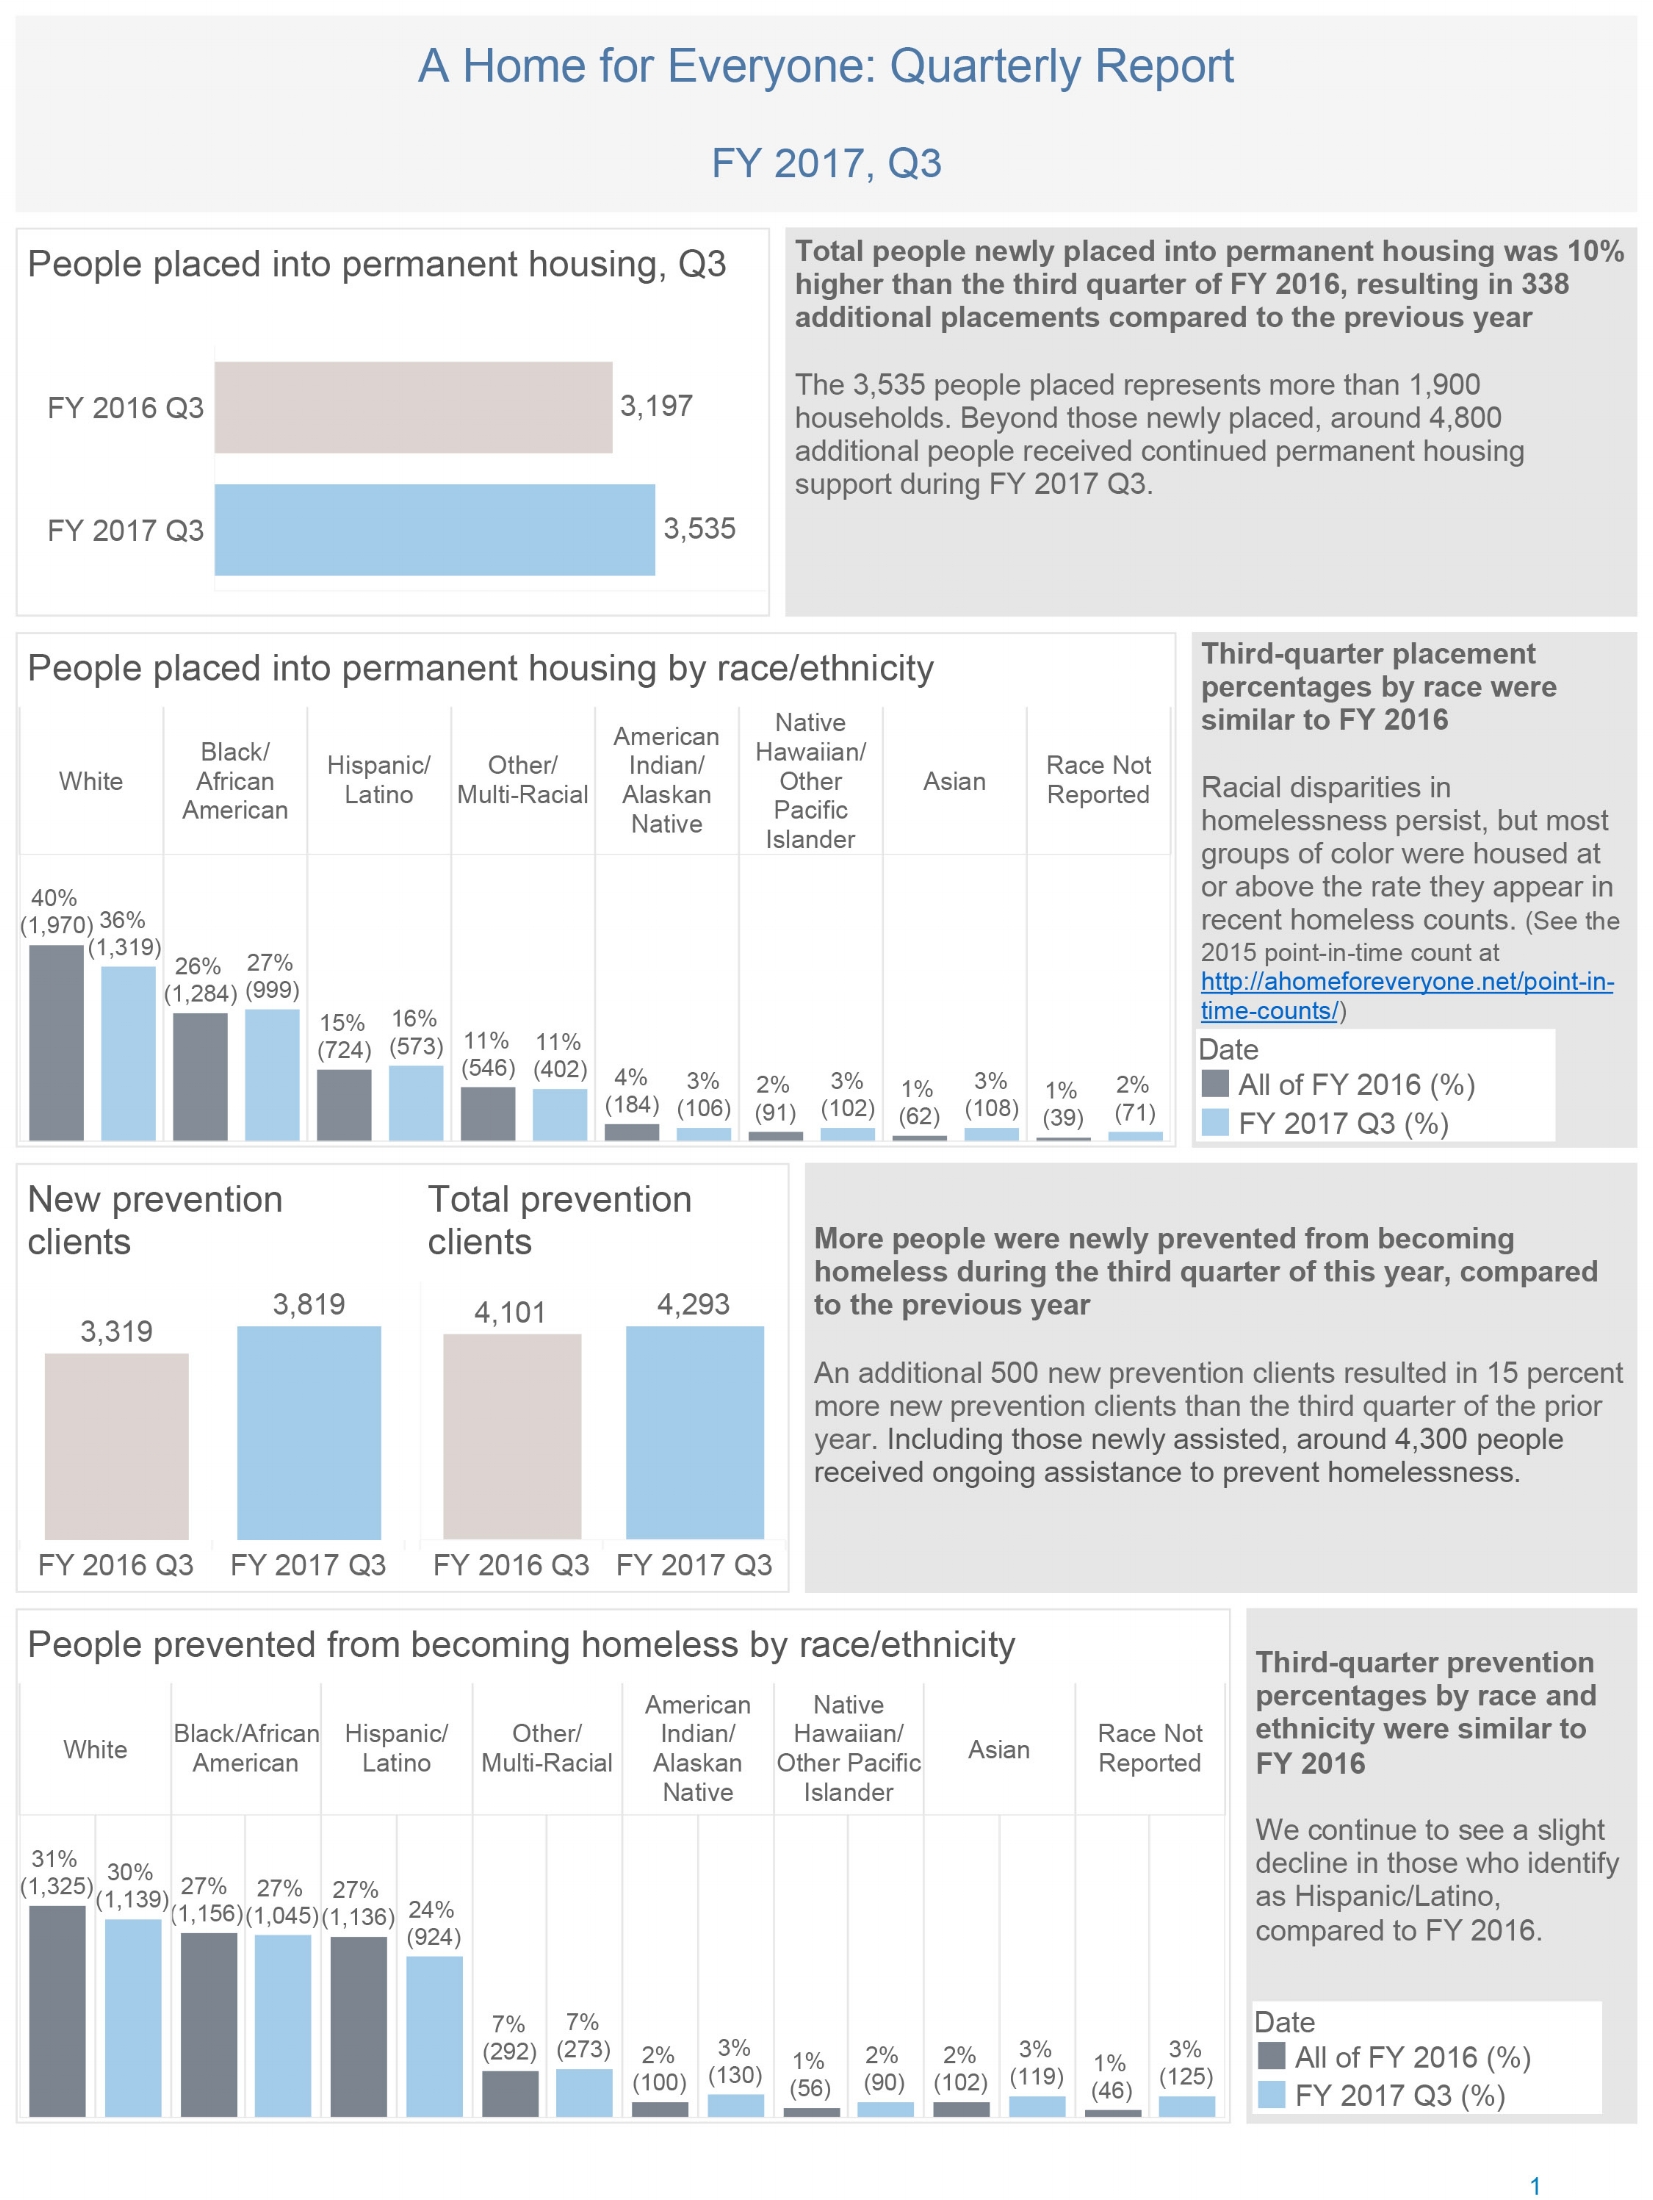
Q3, Fiscal Year 2017
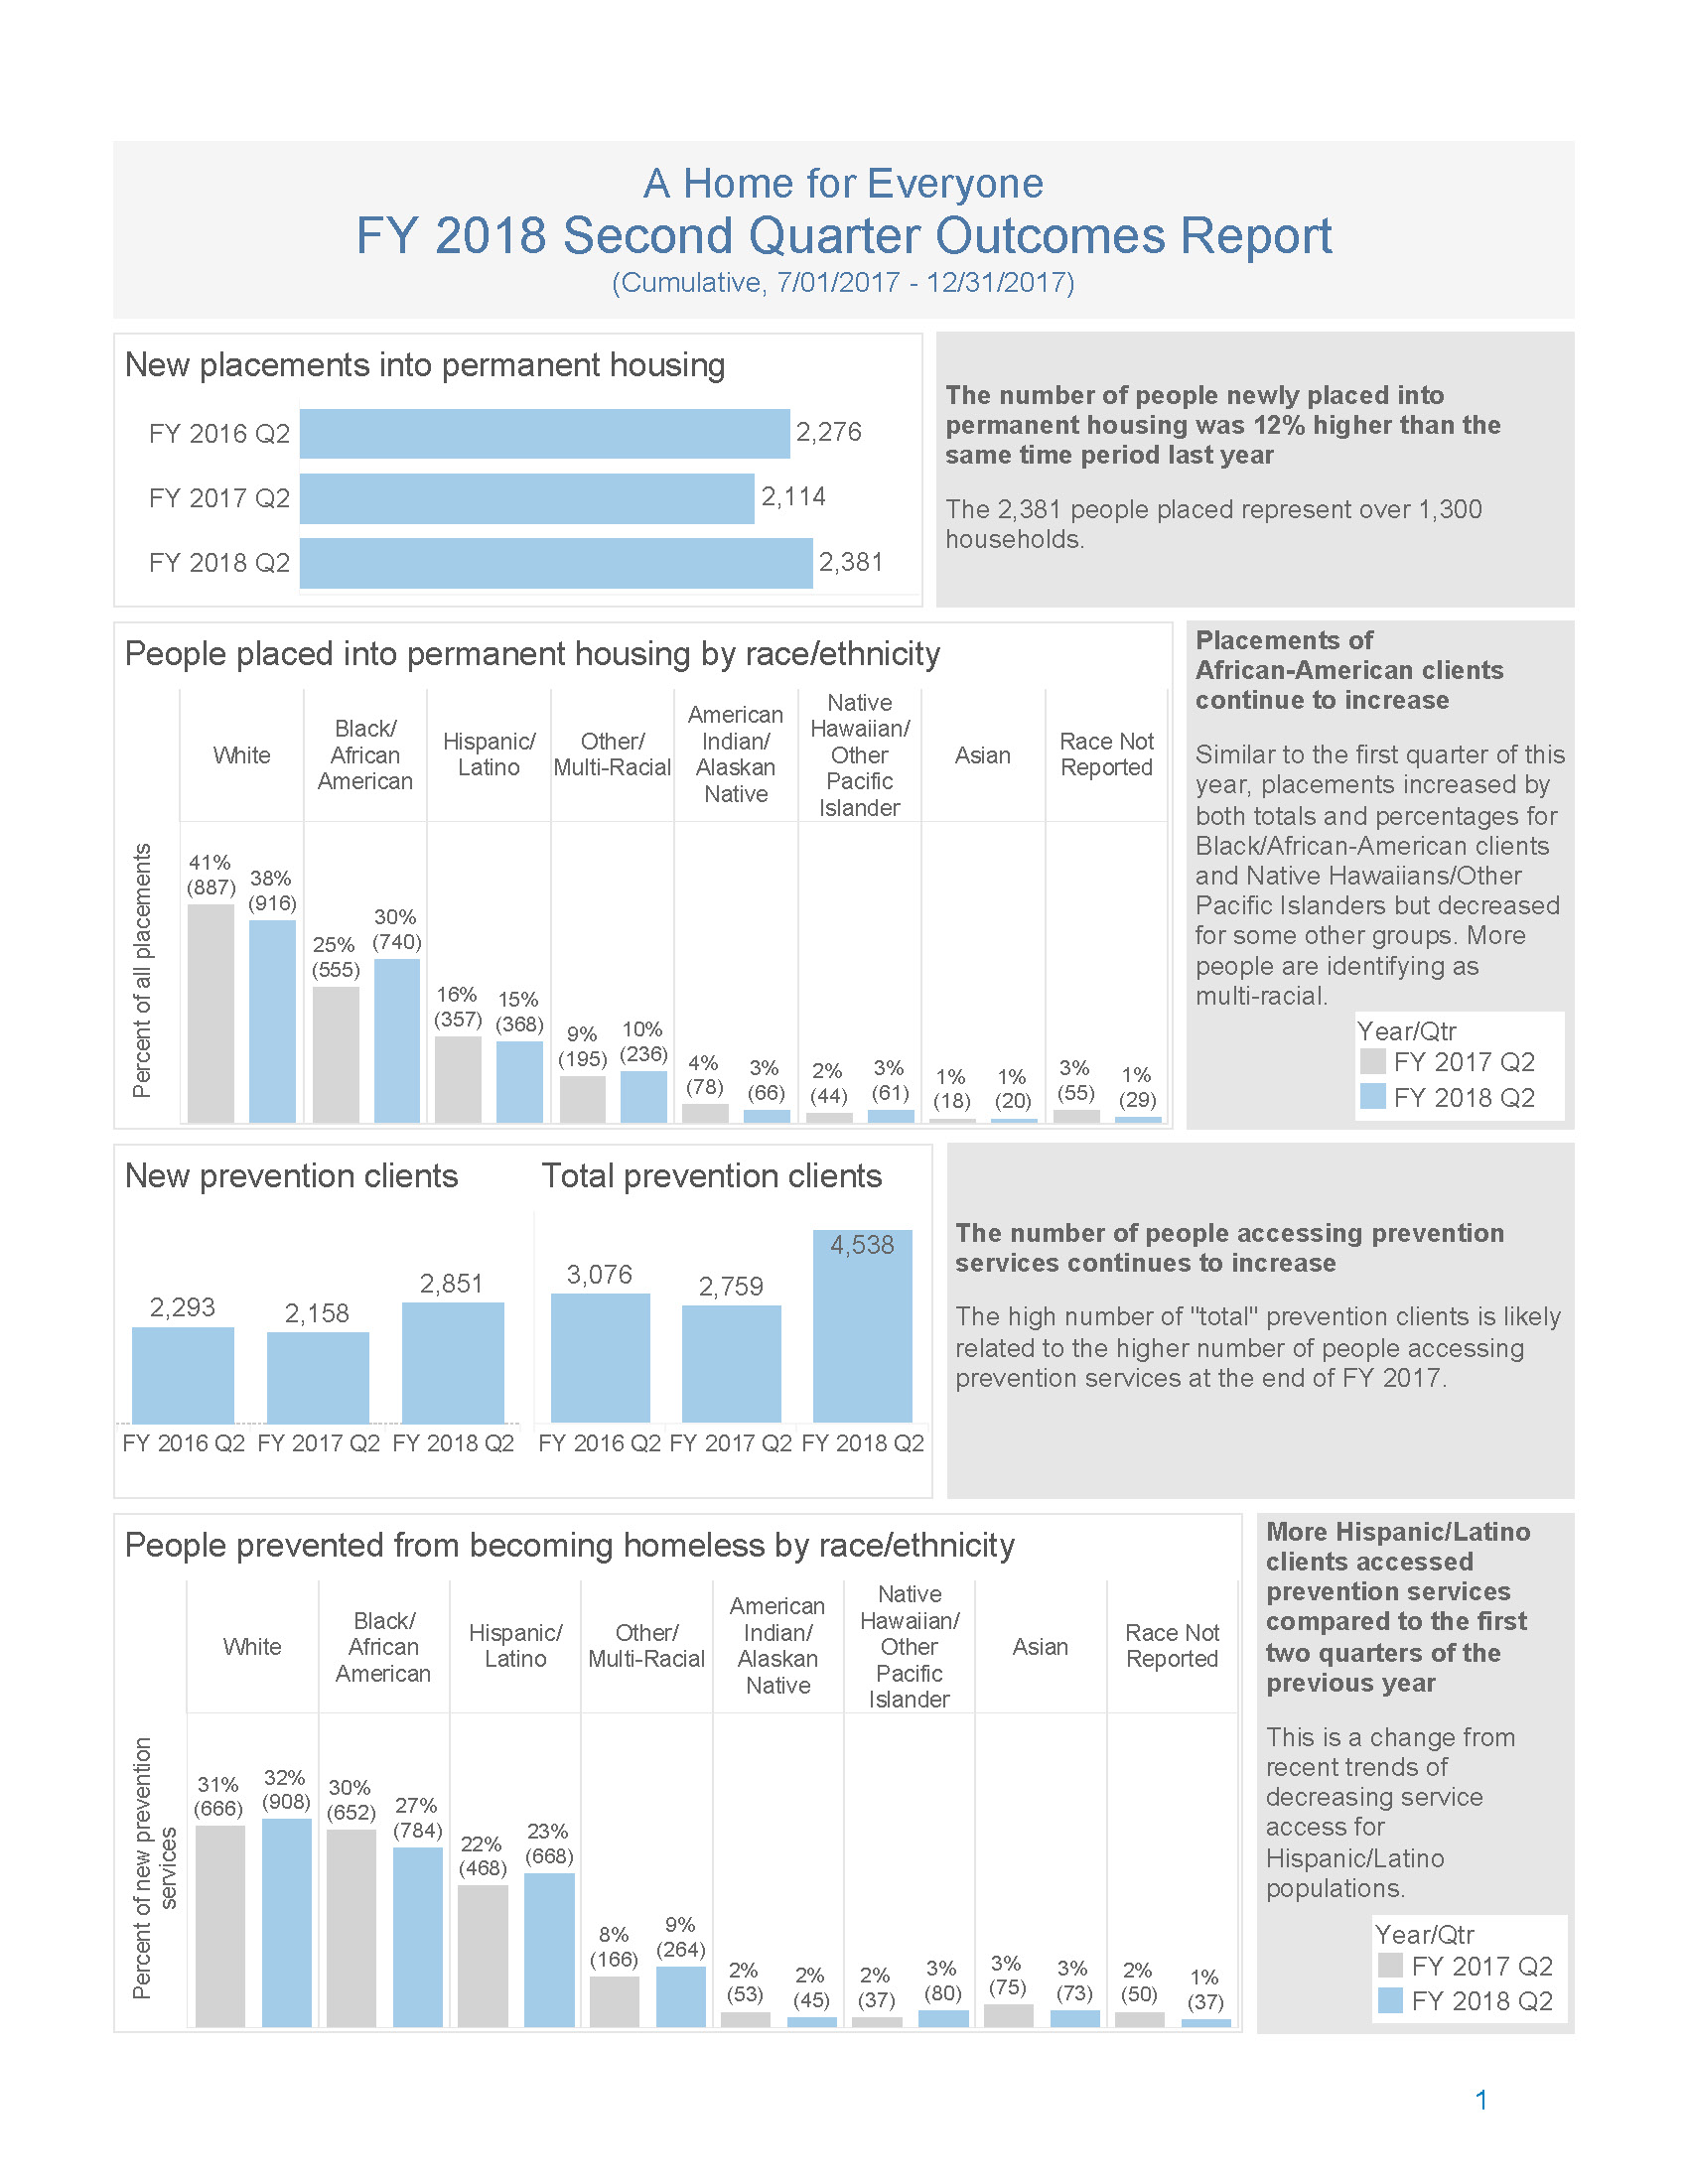
Q2, Fiscal Year 2018
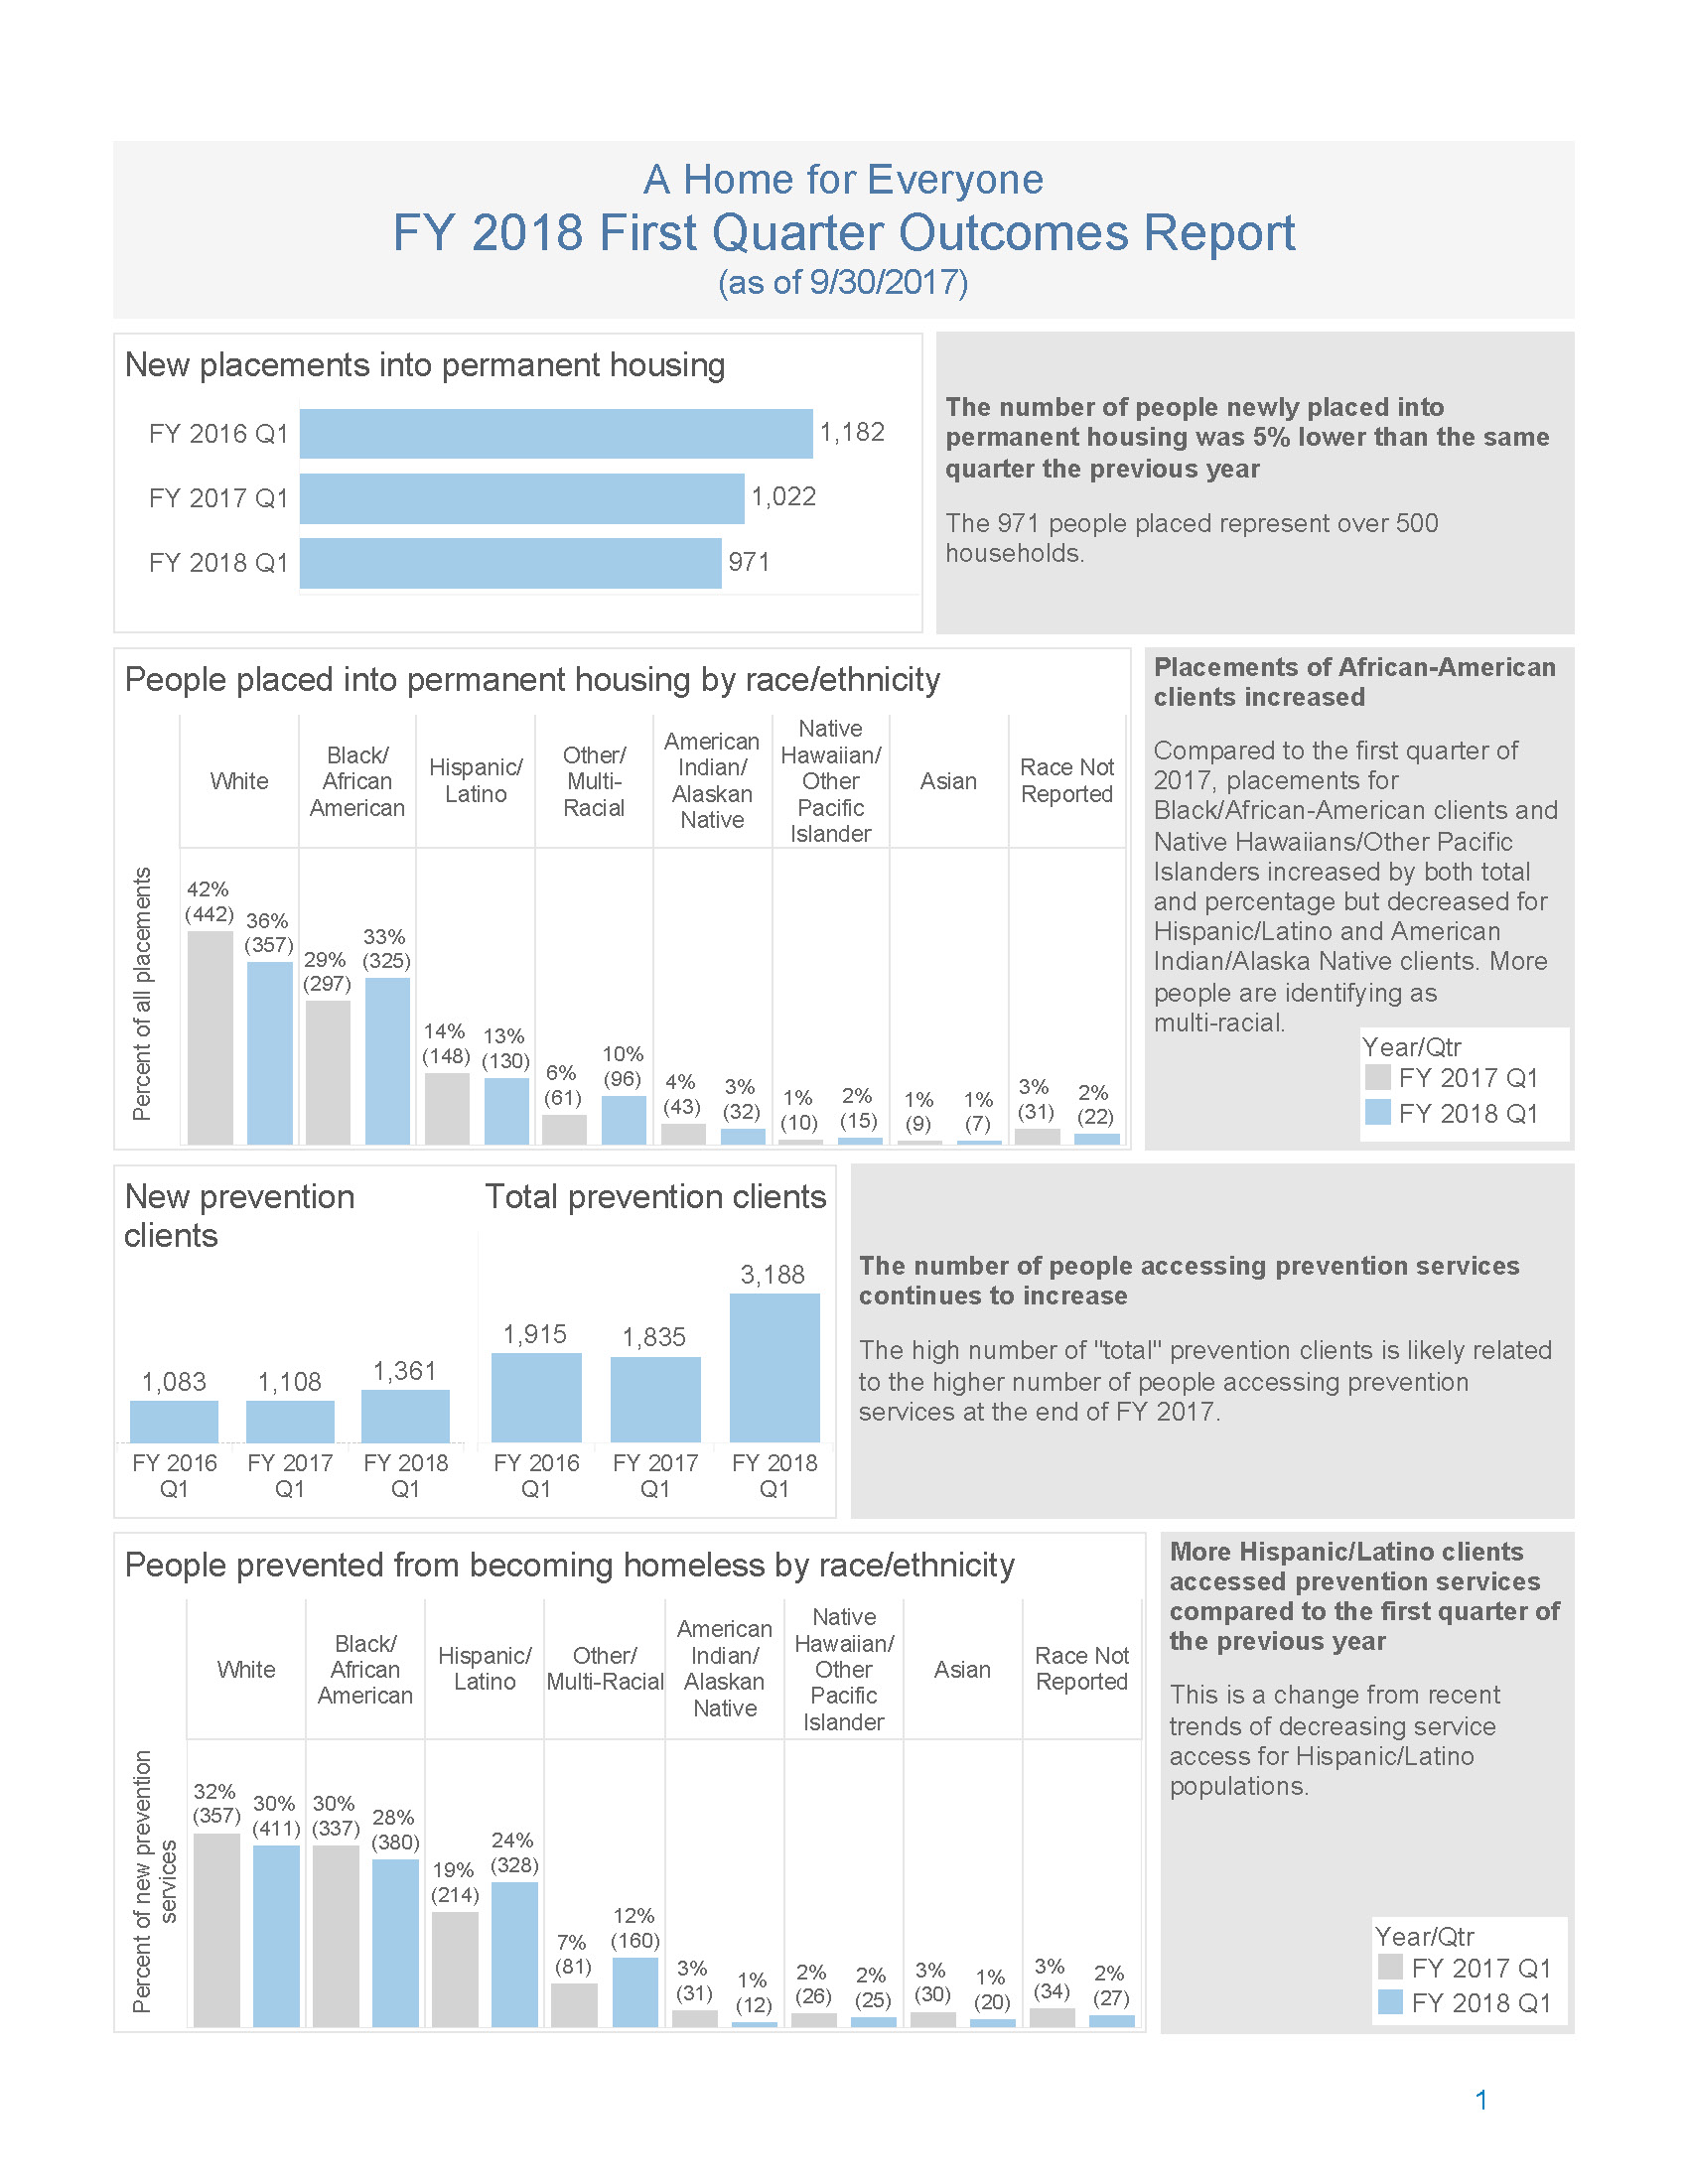
Q1, Fiscal Year 2018